

THE GROCERY INDUSTRIAL COMPLEX
You're not paying for food. You're paying for a system that was engineered to extract from you at every single step — and call it a free market while doing it.

Cost of Living | Inflation | Gas Prices | Free Market | Grocery Industrial Complex
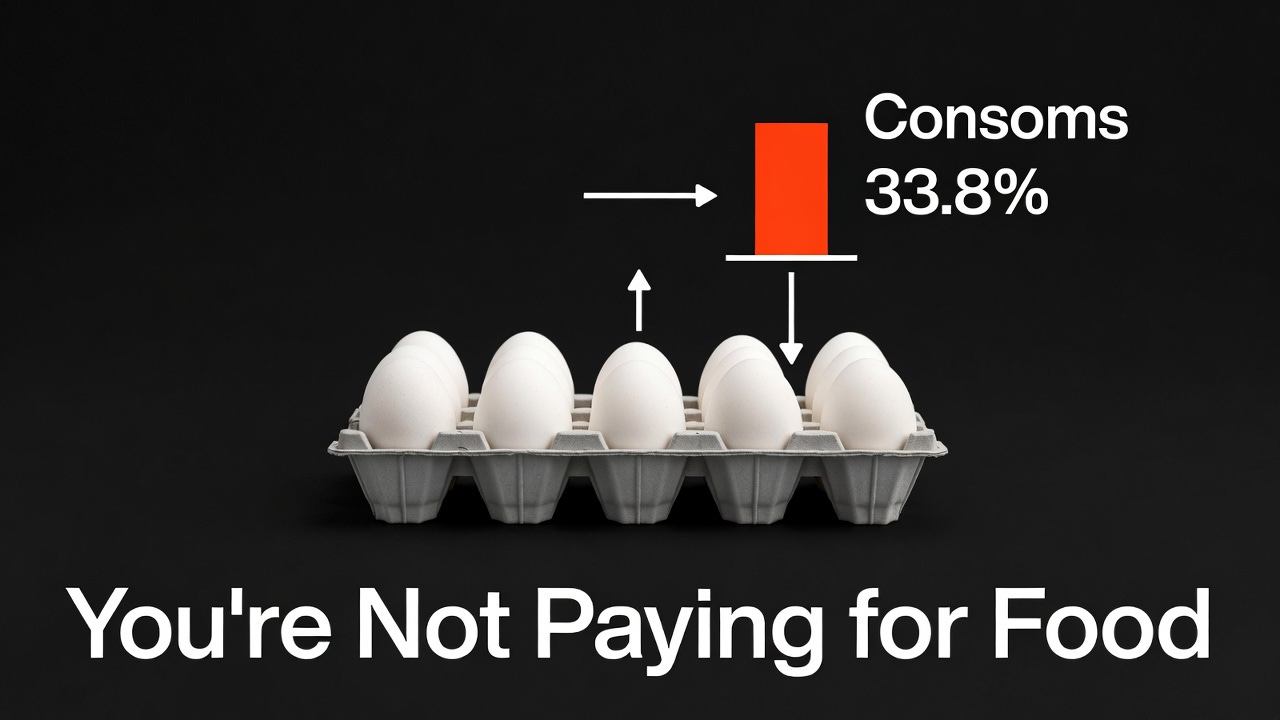
You’re not paying for food.
You’re paying for a system engineered to extract from you at every step—while calling it a free market.
The conversation about grocery prices in America gets framed as economics.
Supply and demand. Inflation. Bird flu. Ukraine.
Pick a villain. Blame the moment. Move on.
But the real problem isn’t a moment.
It’s the architecture.
This isn’t an essay about egg prices.
It’s about a pipeline:
Production → Processing → Distribution → Retail → Finance → Policy
At every stage, the incentive is the same:
extract as much margin as possible.
No one had to sit in a room and design it this way.
The incentives did the work.
What follows is a structural breakdown.
Not vibes.
Numbers.
THE PRICE OF YOUR FOOD (2020–2026)
Most people feel what happened over the last five years.
Your cart costs more.
You don’t need a chart to know that.
But here are the receipts:
+23.6% — U.S. food price increase (2020–2024)
+21.2% — Overall inflation in the same period
Source: USDA ERS / Bureau of Labor Statistics
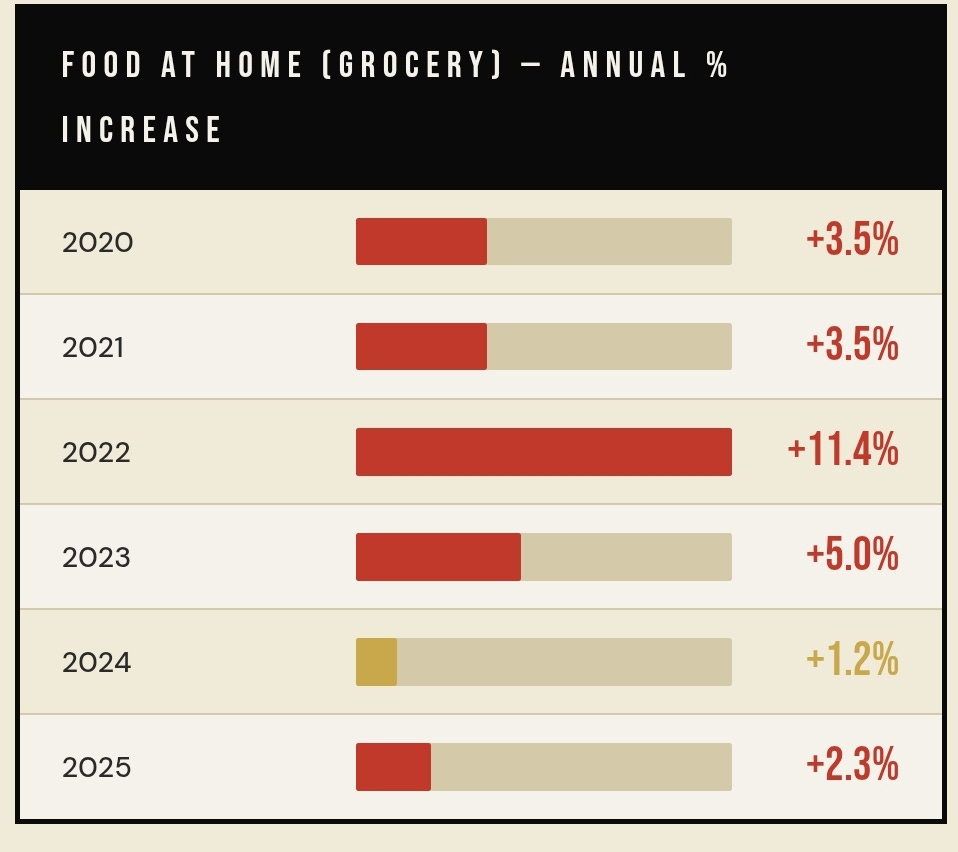
2022 was the worst year since 1979.
The official explanations:
COVID supply chains
Russia–Ukraine
Both real.
Neither explains why corporate grocery profits hit record highs during a “crisis.”
Four numbers that matter more than headlines:
$2.58 trillion — Total U.S. food & beverage spending (2024)
10.4% — Share of disposable income spent on food
32.6% — Lowest income quintile (after-tax)
5.5% — Highest income quintile
Source: USDA ERS, 2024
Let’s translate that into plain English:
The poorest Americans spend SIX TIMES more of their income on food than the wealthiest.
Same food.
Same stores.
Same system.
Six times the burden.
And that’s before we even get into access.
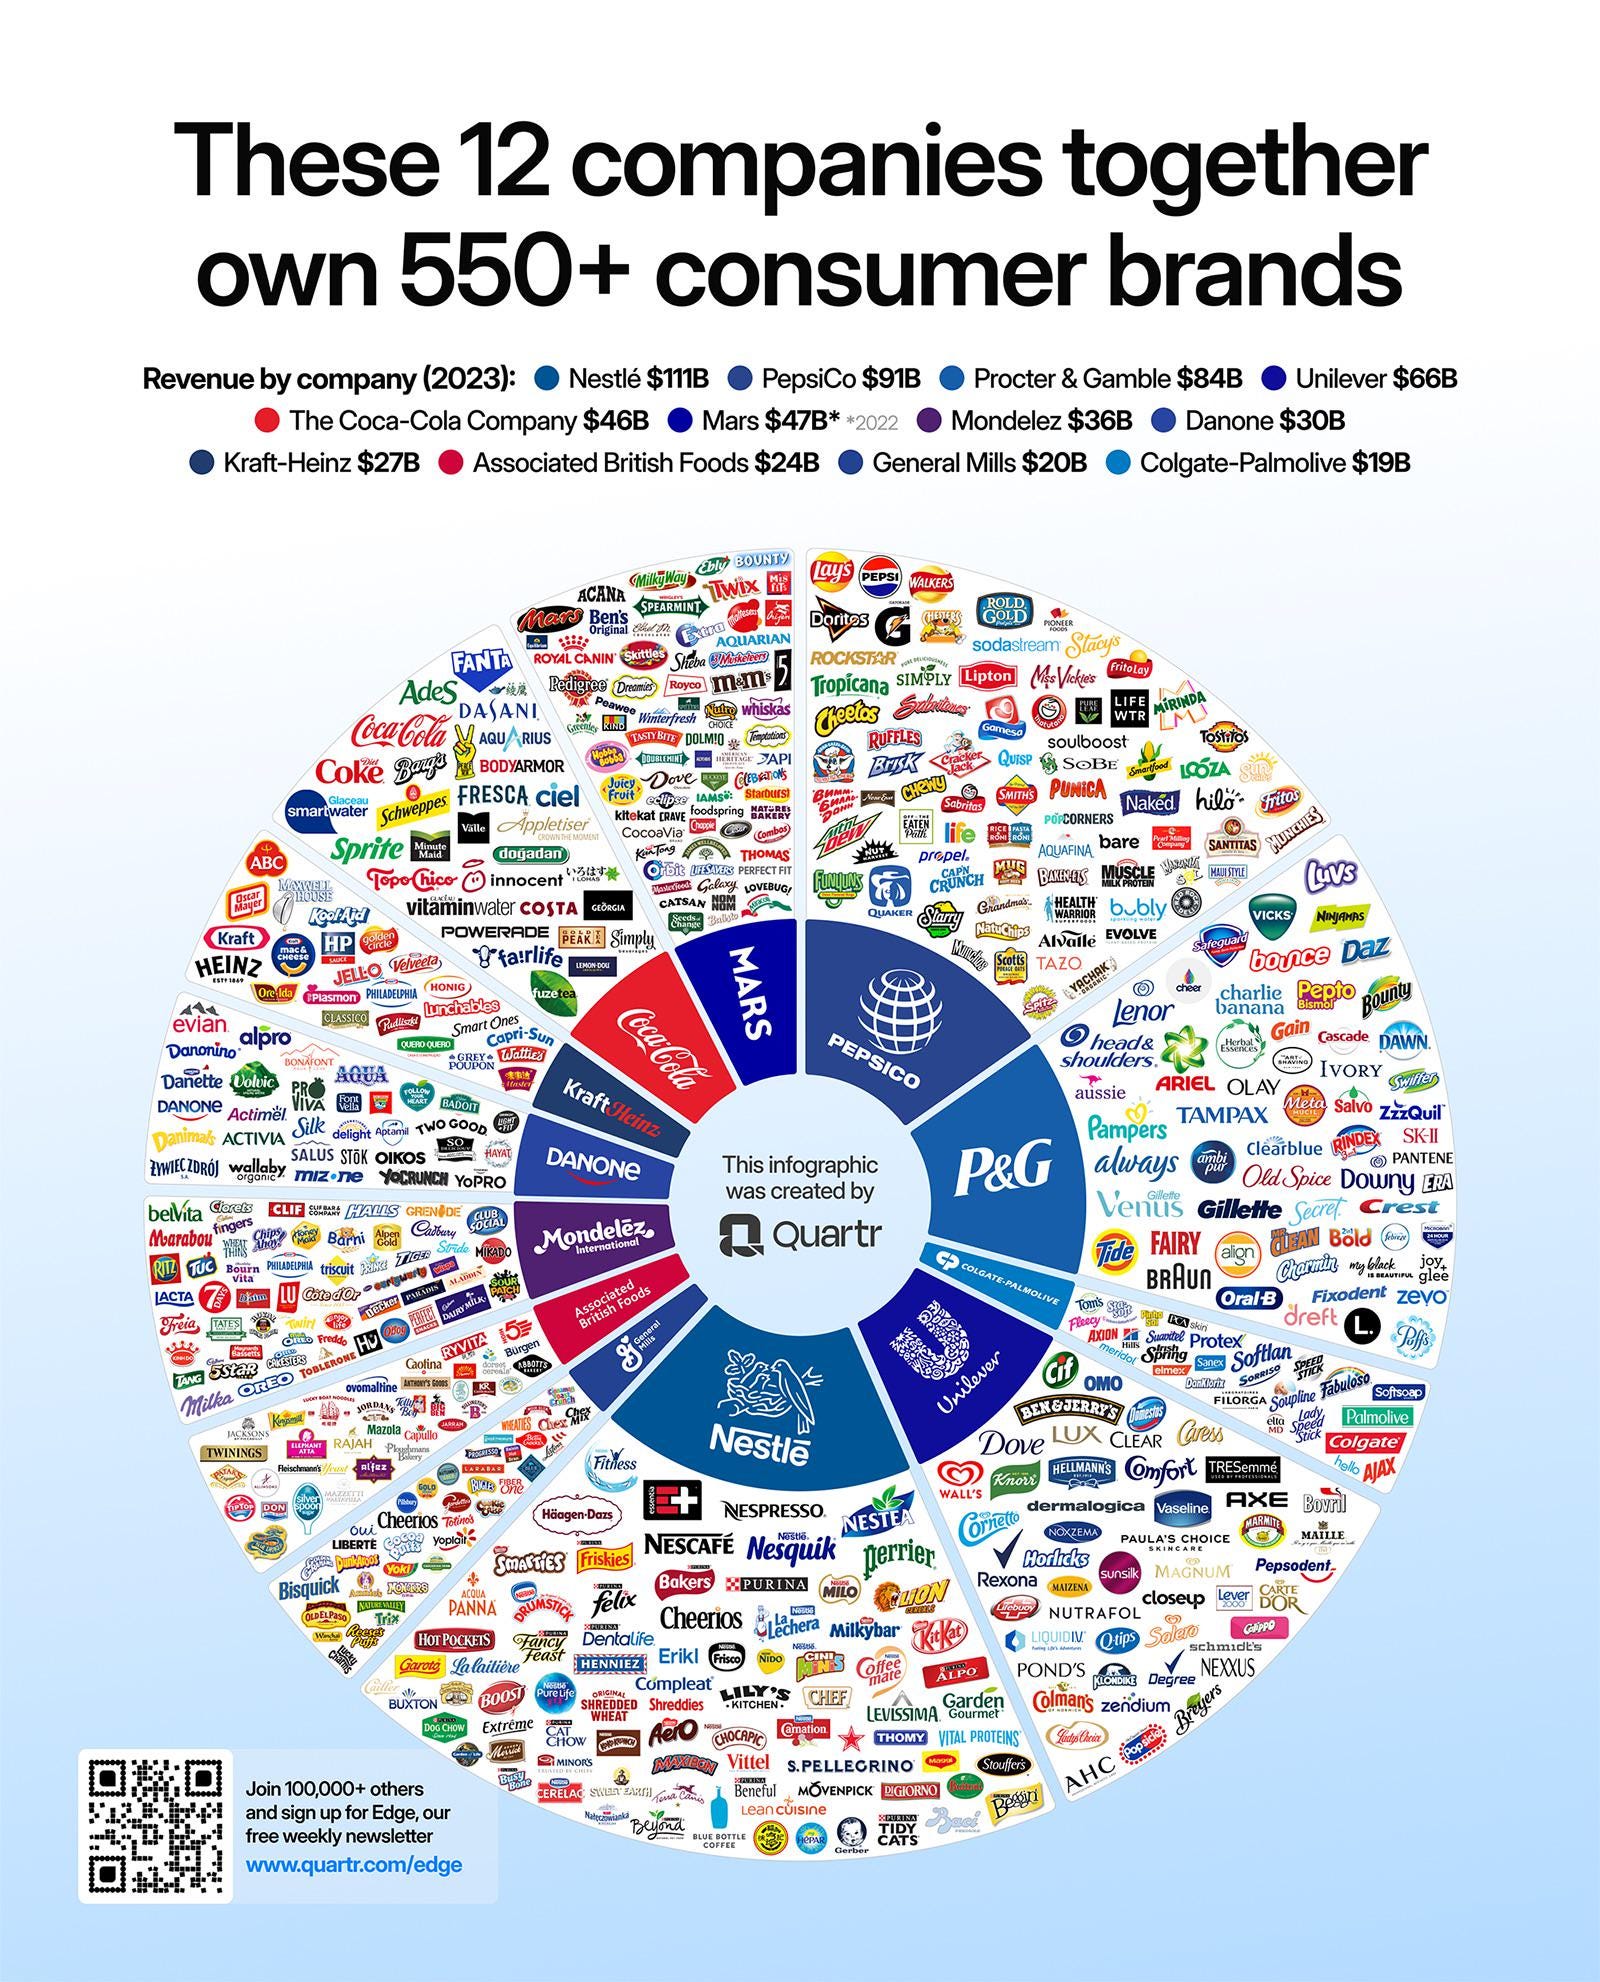
THE ILLUSION OF CHOICE
Walk into any American grocery store.
Forty-foot aisles.
Hundreds of brands.
Twenty-seven versions of the same pasta sauce.
It looks like competition.
It isn’t.
It’s an oligopoly putting on a very convincing performance.
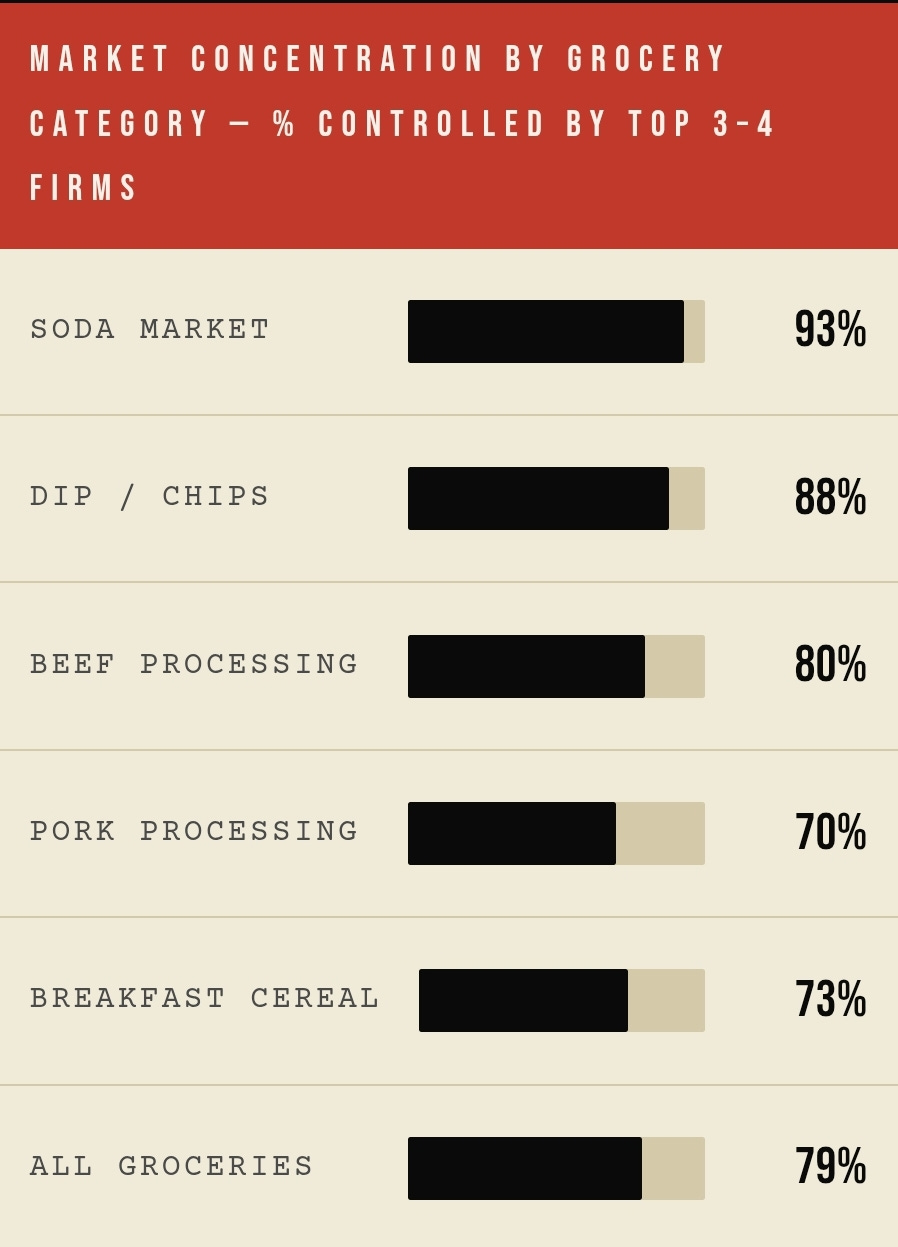
“For almost a third of shopping items, the top firms controlled at least 75% of the market share — despite shelves stacked with different boxes.”
The shelves are crowded.
Ownership isn’t.A handful of parent companies control most of what you see.
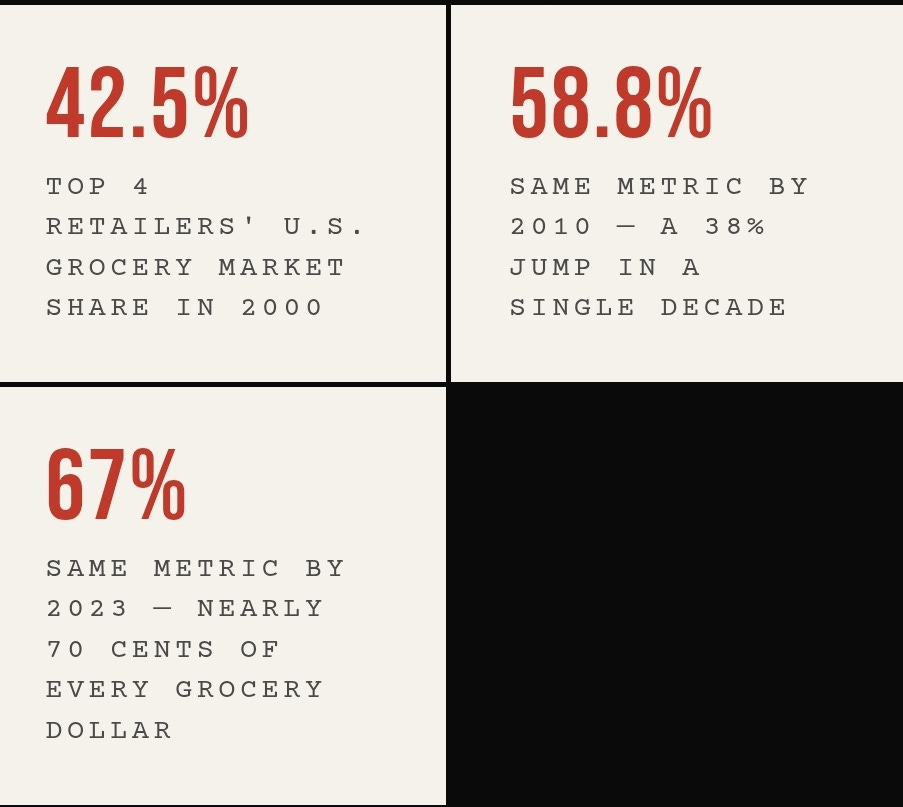
Now zoom out to the stores themselves:
Year Top 4 Retailers’ Market Share Change 2000 42.5% — 2010 58.8% +38% 2023 67.0% +58% since 2000
Source: RAFI USA Grocery Gap Atlas (HHI analysis)
Nearly 70 cents of every grocery dollar now flows to four companies.
Walmart
Kroger
Albertsons
Costco
And a shrinking pool of competitors trying not to get crushed that haven’t been bought by them thus far.
The local grocery store you grew up with didn’t disappear because it “couldn’t compete.”
It disappeared because:
Scale became a weapon
Distribution became gatekeeping
Policy stopped protecting competition
This isn’t a free market.
It’s a concentrated market wearing a free market costume..
THE $523 MILLION QUESTION
That retail consolidation didn’t happen in a vacuum. It happened in Washington. Here’s what it cost — and what it bought.
$523 million — Spent by agribusiness, food manufacturers, and industry groups lobbying Congress on Farm Bill policy between 2019 and 2023. More than 4× what public health advocates and nonprofits spent in the same window.
Source: Union of Concerned Scientists “Cultivating Control” Report, 2024
That’s not an abstract number. Here’s who spent it and what they were purchasing:
U.S. Chamber of Commerce — $67M+
Top Farm Bill lobbyist 2019–2023; broad deregulation agendaBiotechnology Innovation Organization — $35M+
GMO approvals, seed patent protections, pesticide standardsBayer Corporation (owns Monsanto) — $23M+
Pesticide market protection, seed monopoly maintenanceKoch Industries + American Farm Bureau — Top 5
Commodity crop subsidy preservation, weakened antitrust enforcementAmazon ($34M) + Walmart ($12.9M) — $47M+ combined
Lobbying the USDA’s SNAP online purchasing pilot expansion — the program determining which retailers can accept electronic food benefits digitally. Both became top beneficiaries when the program expanded.Coca-Cola + PepsiCo — Active
Hired lobbying firms to influence SNAP eligibility rules for their products
Sources: Union of Concerned Scientists 2024; OpenSecrets Farm Bill analysis, Dec. 2024; FoodDive / AgricultureDive reporting 2024
The consequences are VERY traceable.
According to the Union of Concerned Scientists’ analysis of data:
$177 million — Agribusiness lobbying spend (2023)
$133.8 million — Oil & gas lobbying (same year)
Agribusiness didn’t just show up.
It outspent one of the most powerful industries on earth.
The report states plainly:
Agribusiness “regularly spends more on federal lobbying than either Big Oil or defense contractors.”
That’s not commentary.
That’s pulled directly from Senate disclosure filings.
Now look at the imbalance on the other side:
The Farm Bill expired in September 2023 and got extended another year while Congress stalled.
Meanwhile:
$15 million —
$6 million —
That’s your “public health counterweight.”
The ratio?
Roughly 10-to-1.
And what did that money buy?
Real outcomes. Not theory.
Country-of-origin labeling for beef — eliminated
→ Blocked by the the national Cattlemen's Beef Association
Acting on behalf of:Cargill
Tyson Foods
McDonald's
Result: You don’t know where your ground beef comes from.
SNAP online purchasing expansion — shaped by corporate lobbying
→ Nearly $47 million spent by:Amazon
Wal-Mart
Result: The biggest retailers became the biggest beneficiaries.
Commodity crop subsidies — unchanged
→ Same structure
→ Same incentives
→ Same outcomes
The public health side was outspent 10-to-1.
So let’s drop the polite fiction:
The Farm Bill isn’t written in Congress.
It’s negotiated in lobbying disclosures.
Send the next section. The machine isn’t done explaining itself.
THE PIPELINE: HOW IT ACTUALLY WORKS
Strip away the branding. This is the machinery underneath — six layers, each one extracting margin from the one before it:
Agribusiness — Controls seeds, fertilizer, and what gets grown at scale (Production)
Commodity Processing — Corn → syrup, oil, starch. Soy → protein, oil, filler (Transformation)
Ultra-Processed Manufacturing — Assembly of cheap inputs into high-margin shelf products (Margin Extraction)
Distribution — Centralized logistics; small brands can’t access the network (Access Control)
Retail (Oligopoly) — Shelf placement fees, pricing control, data on your habits (Pricing)
Finance & Policy — Lobbying, subsidies, deregulation — the scaffold for all of it (Control Layer)
Every step in that chain extracts margin. Every step is reinforced by lobbying. Every step concentrates power upward. By the time you scan your card at checkout, you’re at the end of a machine that has already tilted the odds — on what’s available, what it costs, and which neighborhoods have access to fresh alternatives and which ones don’t. It doesn’t control your choices. It narrows them before you walk in the door.
THE SUBSIDY EQUATION
If you want to understand why processed food is cheap and produce is expensive, you don’t need an economics paper. You need one chart.
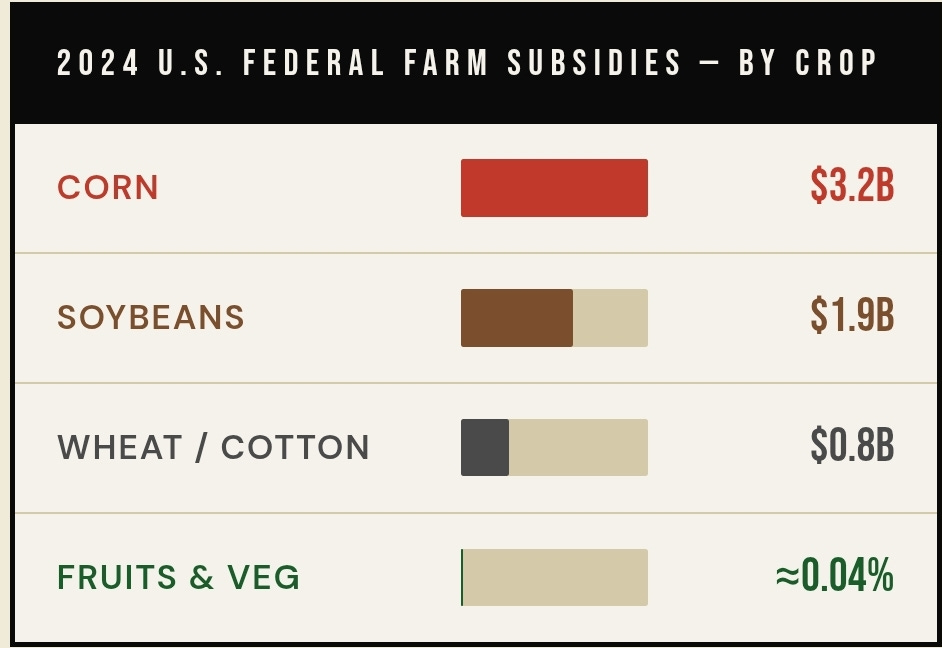
Read that bottom line again. Fruits and vegetables — the foods every nutrition guideline in America says we should be eating more of — receive a fraction of a percent of federal farm subsidies. Specialty crops like apples and tomatoes receive just 0.04% of total USDA subsidies.
Meanwhile, corn and soybeans eat up nearly 50% of the entire subsidy budget between them. Less than 1% of the corn grown in America is the sweet corn you eat off the cob. The rest becomes high-fructose corn syrup, ethanol, livestock feed, and the industrial inputs for every ultra-processed product on a shelf near you.
90% of agricultural subsidies go to commodity crops (corn, soy, cotton)
10% goes to “specialty crops” — the USDA’s term for fruits and vegetables
6%+ directly funds corn syrup, HFCS, corn starch, and soy oils
50% of Americans’ caloric intake now comes from ultra-processed foods
Sources: FoodTank, Farm Action, TheBalance — agricultural subsidy analysis
The U.S. government is spending billions to make the unhealthy choice the cheapest choice — then spending billions more in public health programs to tell you to eat better. Both programs cancel each other out. That’s not an accident. That’s a budget.
This is where your piece stops being “interesting” and starts making people uncomfortable enough to close the tab. Which, ironically, means it’s working. Let’s make sure they actually read it first.
HOW THE INCENTIVES PRODUCE THE OUTCOME
Six decisions.
Each one rational on its own.
Together?
They build a system that harms public health and loads the cost onto the people least able to carry it.
1 — Subsidize Commodity Crops Heavily, Produce Minimally
$3.2B — Corn subsidies (2024)
0.04% — Fruits & vegetables share
That price signal does one thing clearly:
Processed inputs become artificially cheap.
Fresh food becomes relatively expensive.
2 — Cheap Inputs → High-Margin Processed Products
Ultra-processed food wins because it’s:
Higher margin
Longer shelf life
Lower risk
Result:
~50% of U.S. caloric intake now comes from ultra-processed food
This isn’t a cultural accident.
It’s an economic outcome.
3 — Market Consolidation Controls Access
79% of grocery items controlled by 4 companies
67% of retail spending flows to 4 parent companies
You see options.
The system sees control.
Shelf placement fees and distribution lockouts make sure smaller players don’t break through.
4 — Pricing Stratifies by Zip Code
Same product. Different price. Different reality.
+3–37% — What urban residents pay at corner stores
32.6% — Income spent on food (lowest quintile)
5.5% — Income spent (highest quintile)
Six times the burden.
5 — Low-Margin Communities Get Deprioritized
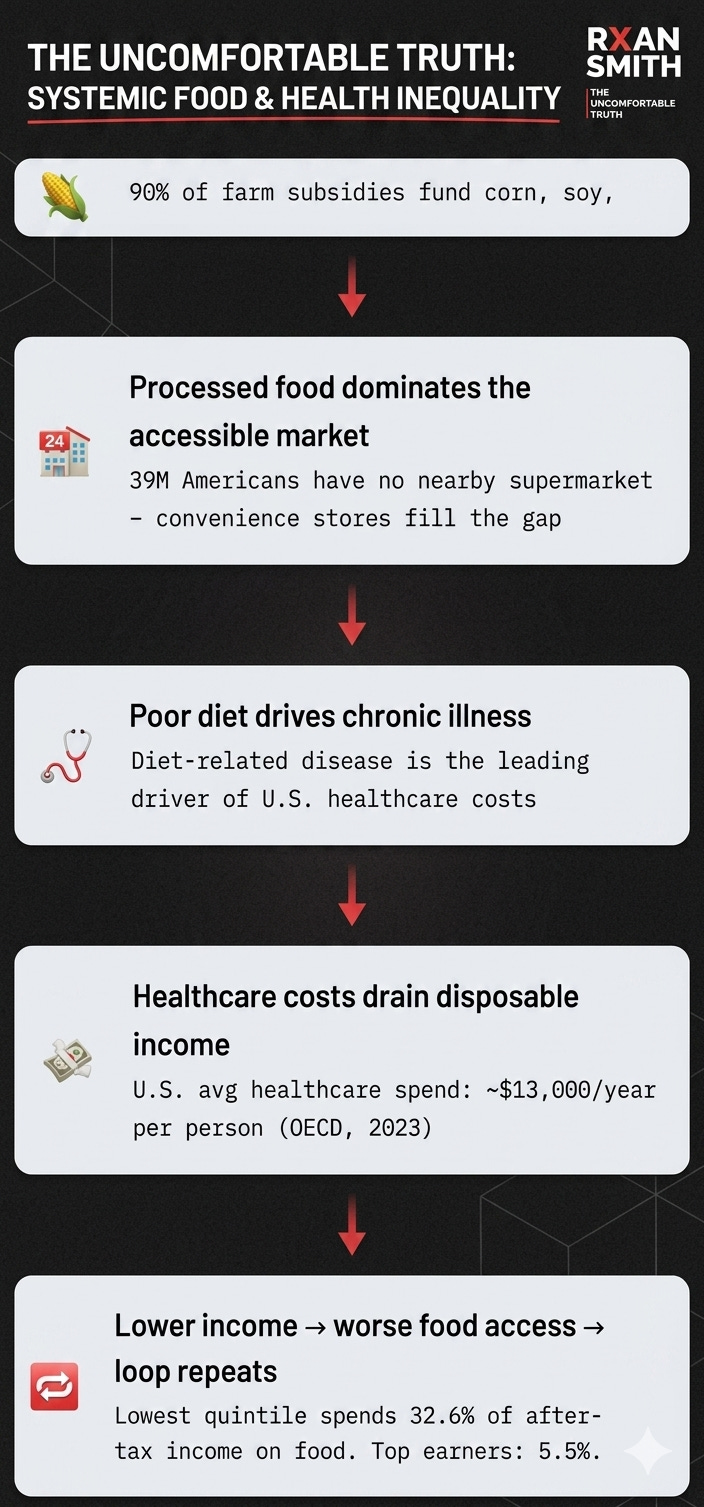
39 million Americans live in low-income, low-access areas
If fresh food doesn’t hit margin targets, it doesn’t show up.
So what fills the gap?
Dollar stores.
Processed food.
Higher per-unit costs disguised as “cheap.”
6 — Health Costs Get Externalized
The system keeps its profits.
The public absorbs the damage.
Chronic disease → healthcare system
Rising premiums → everyone
Medicaid & Medicare → downstream costs
Profit stays private.
Consequences go public.
FOOD DESERTS — WHERE THE MATH BECOMES A FACE
Let’s isolate the number most people skim past.
Because it’s the entire story.
The Burden Gap
32.6% — Lowest-income households
5.5% — Highest-income households
Same food.
Same system.
6× the burden.
Source: USDA ERS, 2023
“Cheap food” isn’t cheap.
It’s only cheap if you can absorb it.
For lower-income households, food isn’t a category.
It’s a pressure point.
And the system responds how?
Not with lower prices.
With lower quality and less access.
What a “Food Desert” Actually Looks Like
This isn’t market failure.
It’s market calculation.
39 million Americans
→ Low-income, low-access areas
→ 1+ mile from supermarkets (urban), 10+ miles (rural)19 million people
→ No nearby supermarket at all500,000+ Chicago residents (mostly Black)
→ In food deserts
→ Another 400,000 in areas with only fast food+3–37%
→ Premium paid at corner stores vs. supermarkets+75%
→ Increase in fresh produce prices (1989–2005)
→ Fatty foods dropped 26% in the same period
Sources: USDA ERS; Food Empowerment Project; Annie E. Casey Foundation
Food deserts aren’t accidents.
They’re what happens when a system decides:
“This community doesn’t meet margin requirements.”
The term some researchers now prefer isn’t “food desert.” It’s supermarket redlining.
Large chain supermarkets didn’t just “fail” to serve certain areas. They systematically relocated out of inner cities or declined to open in lower-income neighborhoods. That’s not a market signal. It’s a pattern with a history.
Part of that history traces back to the Robinson-Patman Act weakening of the in the 1980s. The law was designed to protect smaller local stores from predatory pricing by large chains. When enforcement faded, so did those protections.
That’s when the deserts started forming.
A 2025 UCLA Anderson study on dollar store expansion found something even more telling:
Dollar store entry doesn’t just coexist with grocery stores.
It pushes independent grocers out of the market.
Three or more dollar stores in an area
→ associated with one fewer independent grocer within a two-mile radius
The impact goes deeper:
Low-income households reduced fresh produce spending by up to 30% in areas with three or more dollar stores
The mechanism matters.
Dollar stores didn’t replace major grocery chains.
They displaced independent grocers—the last remaining source of affordable fresh food in many of these communities.
Today, dollar stores exceed 27,000 U.S. locations.
They carry little to no fresh produce.
And their per-unit prices are often higher than supermarkets, despite the appearance of low cost.
That’s not a gap in the system.
It’s what happens when the system decides exactly how much access a community is worth.
US VS. EUROPE: THE HONEST COMPARISON
This section exists specifically to preempt the easy dismissal: “So you want America to be Europe.” No. The point is structural comparison, not advocacy. And an honest comparison includes the trade-offs.
First, the inconvenient truth for the “Europe is cheaper” crowd:
+61% — Switzerland food prices above EU average (Eurostat 2024). Europe’s most expensive country is dramatically pricier than the U.S.
+20% — Denmark and Luxembourg food prices above EU average. Western Europe’s high-cost countries rival or exceed U.S. prices.
−22% — Romania food prices below EU average. Eastern Europe is substantially cheaper, but wages are too.
Source: Eurostat Comparative Price Levels for Food, 2024
Europe is not a monolith. It’s 36 countries with a 61-point spread in grocery prices. The relevant comparison isn’t “U.S. vs. Europe” — it’s “U.S. system design vs. European system design.”
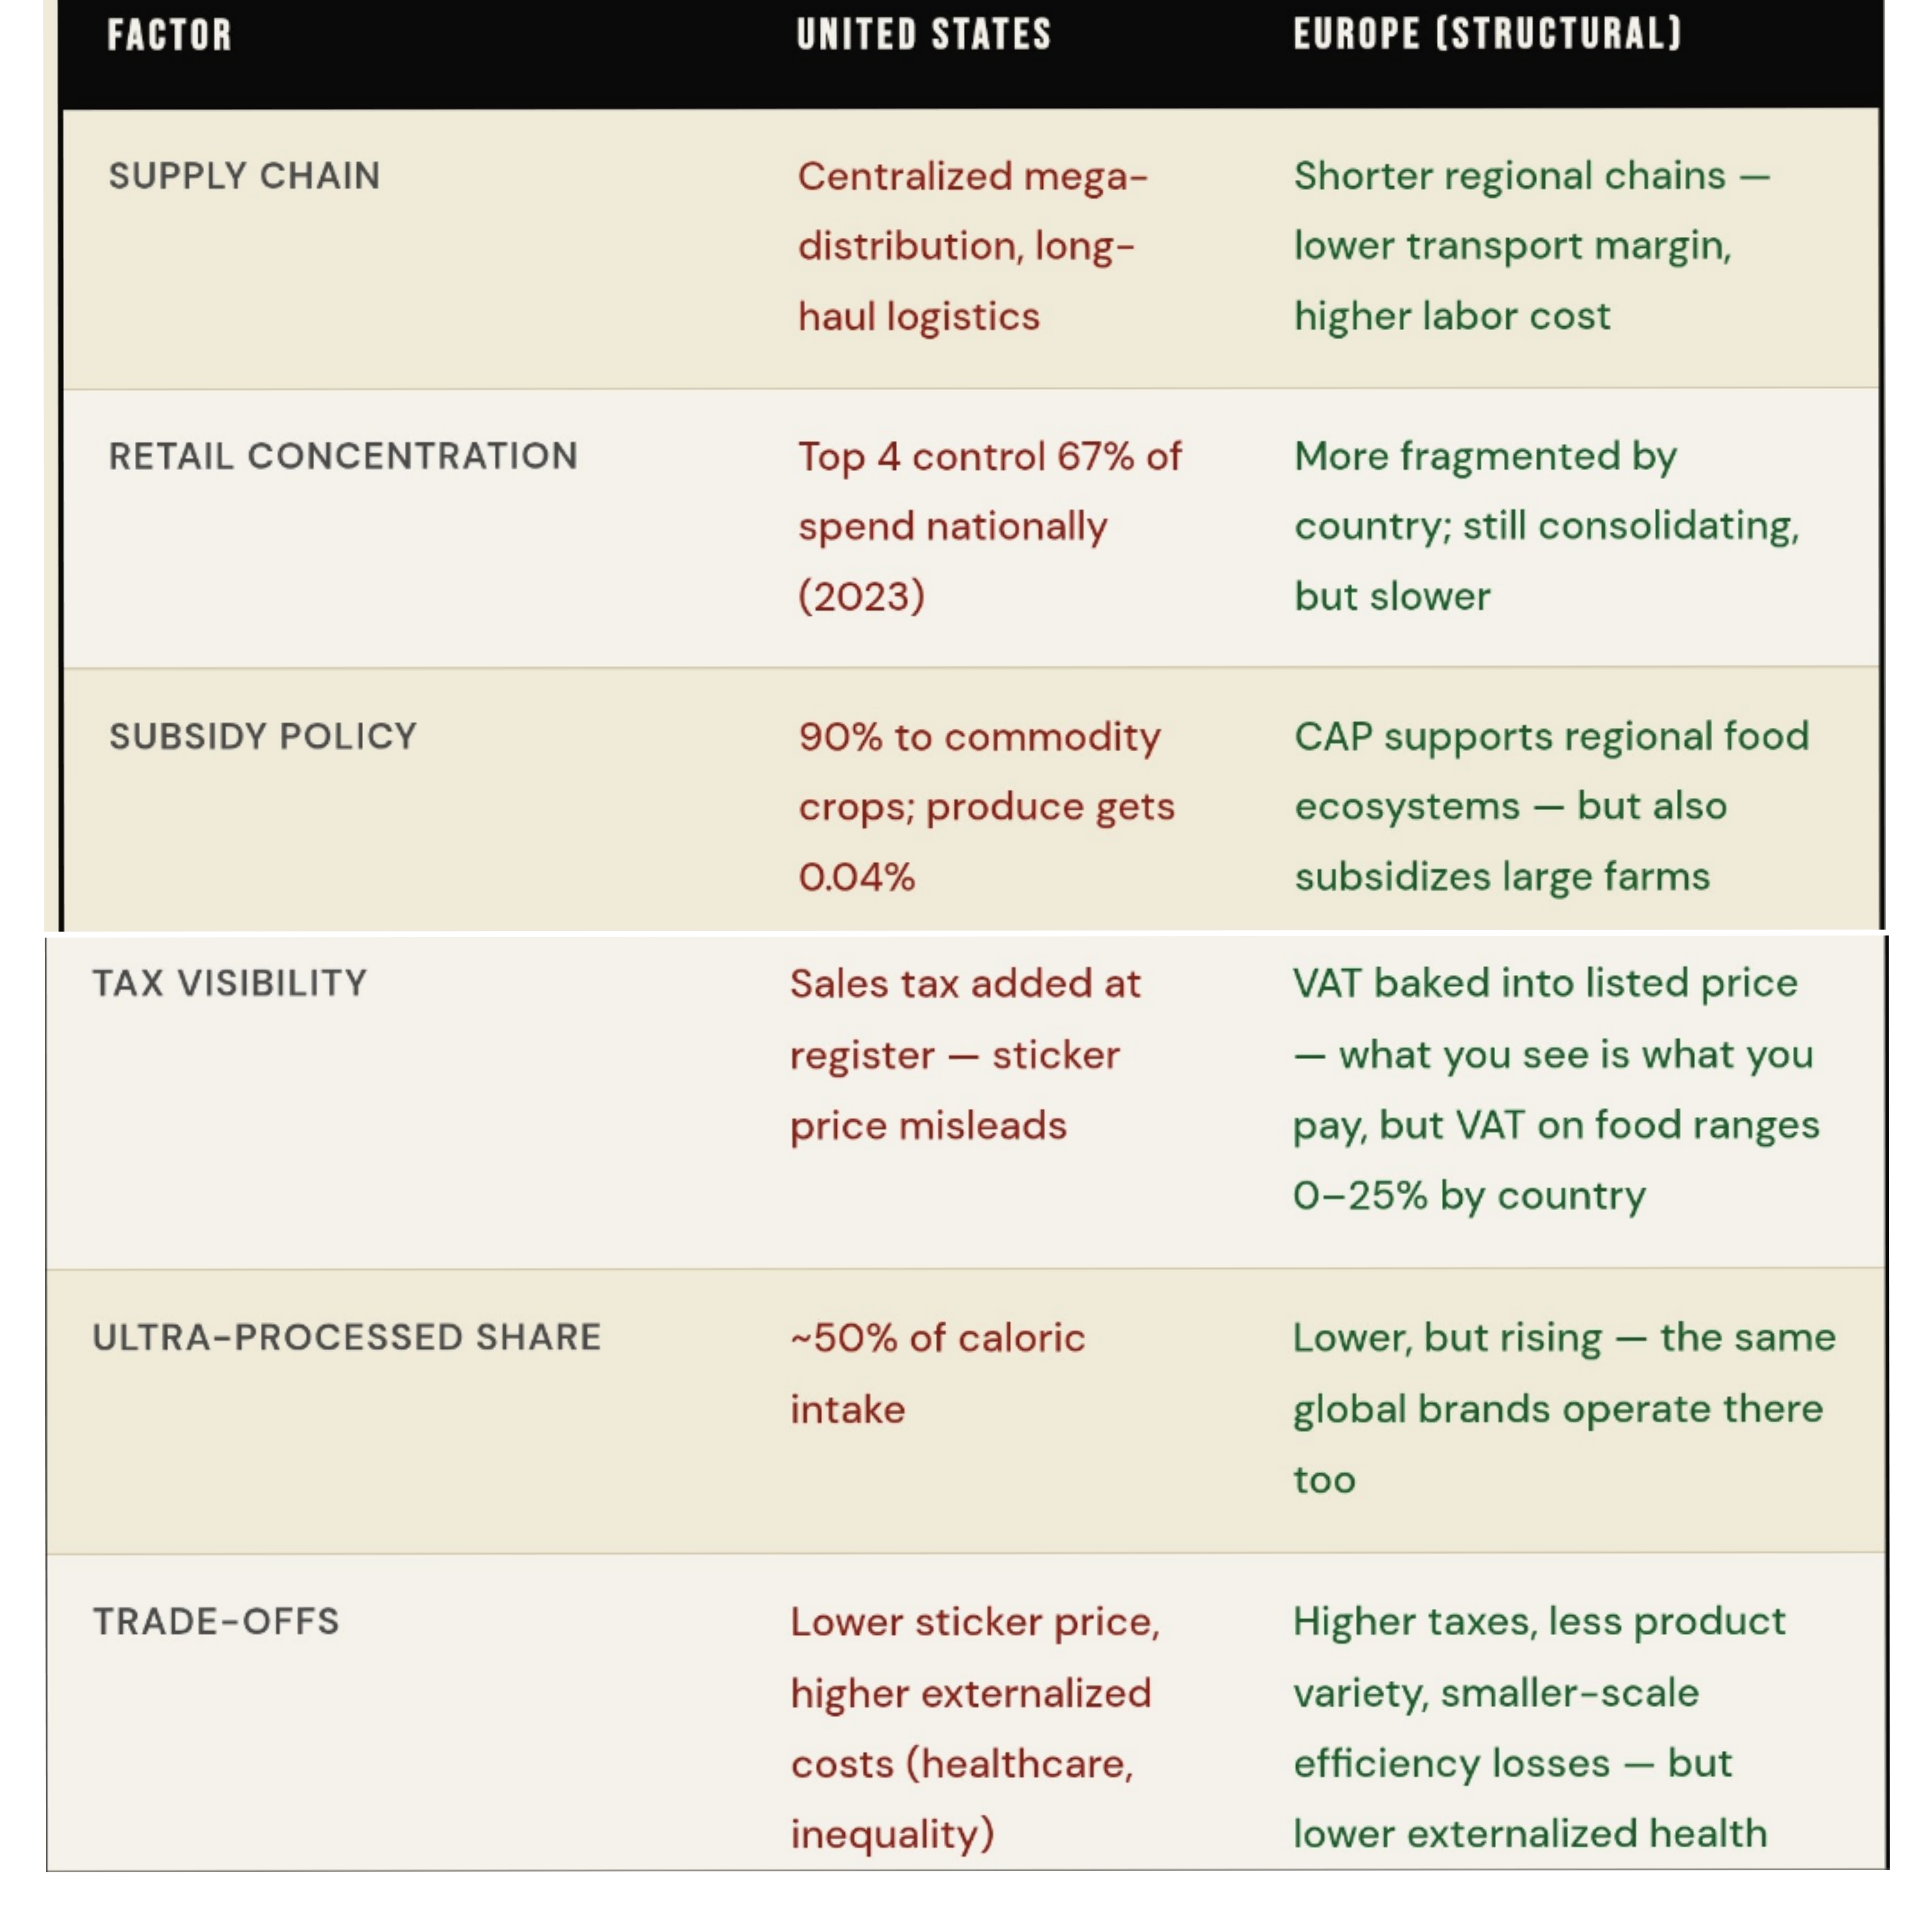
The real difference isn’t that Europeans are smarter or more virtuous about food.
It’s structural.
European policy was built around regional food security as a goal.
Not just commodity output. Not just export volume.
The Common Agricultural Policy has flaws. Plenty of them.
But it still explicitly aims to protect smaller farms and local food ecosystems.
The American Farm Bill?
As the lobbying data shows, its primary beneficiaries are commodity-scale corporations.
This is your closing stretch, which means two things:
It needs to hit harder, not longer
Readers are already half out the door unless you tighten the grip
Here’s the cleaned version. Same message, less drag, sharper landing.
The real difference isn’t that Europeans are smarter or more virtuous about food.
It’s structural.
European policy was built around regional food security as a goal.
Not just commodity output. Not just export volume.
The Common Agricultural Policy has flaws. Plenty of them.
But it still explicitly aims to protect smaller farms and local food ecosystems.
The American Farm Bill?
As the lobbying data shows, its primary beneficiaries are commodity-scale corporations.
The U.S. has “cheap food” the same way it has “affordable healthcare.”
It looks cheap…
until you include what the system offloaded somewhere else.
THE FEEDBACK LOOP
This is where the conversation stops being about groceries
and starts being about systems.
Because these aren’t separate problems.
They are one machine
The machine keeps running because every major player benefits:
Agribusiness lobby
Food manufacturers
Retail chains
Pharmaceutical companies treating diet-related disease
No single villain.
No secret meeting.
Just a structure where every rational actor is rewarded for maintaining the problem
and insulated from its consequences.
THE BOTTOM LINE
The United States doesn’t have a food access problem.
It has a profit architecture built on top of a food supply.
And that architecture produces predictable outcomes:
Cheap calorie-dense inputs
Expensive fresh food
Pricing that varies by geography and income
Health costs pushed onto the public
Nobody had to conspire to build this.
The incentives did it.
Corn gets $3.2B because corn lobbyists showed up
Supermarkets left low-income areas because margins didn’t work
Processed food dominates because it pays better than produce
Each decision? Rational.
The outcome?
A slow-motion public health emergency.
Other countries didn’t solve this.
They just built different incentives.
That’s the whole difference.
FOOD DESERTS AREN’T ACCIDENTS.
THEY’RE BUSINESS DECISIONS...
IF THIS MADE YOU UNCOMFORTABLE, GOOD…. That's my goal. If I can make you uncomfortable with truth, then more people will pass the word, and get uncomfortable together, and form the groups that we need to lead the 25 revolutions necessary to fix this country for it's too late.
$5 — You’re uncomfortable but broke. Respect.
$10 — You forwarded this to someone who needed it.
$25 — You understand structural critique is a public service.
$50 — You want this operation to stay independent.
$100 — You know nobody else is going to say this stuff.
$250 — You believe the free press shouldn’t be free for corporations.
$500 — RXAN OWES ME (but not in a quid pro quo way 😏
☕ buymeacoffee.com/rxansmith | 💸 paypal.me/phireballsports
Rxan Smith: Uncomfortable · uncomfortablerxansmith@gmail.com · uncomfortable.rxansmithmedia.com · @rxannsmith
No sponsors. No advertisers. No editorial leash. Equal-opportunity critique since day one..
How Our Misplaced Outrage on the Left Elected Trump — Again

I updated February 2026. Originally published 2025. Same thesis. More receipts.


All part of the same monster. Fucking horrendous, smh grrr
Hmmm.
It’s all of a piece. The drive for Monopoly Capitalism is almost genetic.
Fossil Fuels & over processed foods produced by huge corporations are part of the same problem & have been for at least 60 yrs.
Us hippies used to dumpster dive for food until they installed monster garbage machines.
The local “Farmer’s” Markets, “Pure Organic” & anti-processed foods movements grew out of our desire to side step the monopoly colossi that were delivering poison disguised as food.
Hyper vigilance and strict laws are a start. Right now the racist reactionary monopolists have control of the government & the officials & oversight structures have been captured by the corporate behemoths.
We have, in IT & the MCP - AI, so called, the tools to take back control. A MCP is the perfect watchdog, as long as it’s given the correct algorithms.
Leash & collar the Tech & Billionaire Bros & smash the monopolists.
Put the new tech in service of all of us.
We Shall Overcome
Resist
Avance la Lucha